Cyclecraft is "destroying" UK cycling

Status
Not open for further replies.
Page may contain affiliate links. Please see terms for details.
I think you are right - the "critical mass" of cyclists sometimes in central London, and sometimes outside central London alters drivers' behavior significantly.

The problem I have with the "safety in numbers" argument is that - unless us cyclists all decide to go everywhere in groups - there will always be times when the roads are under this "critical mass" even in Central London. Then the drivers can revert to type and all the advantages of the "safety in numbers" argument goes out of the window. Clearly getting used to large numbers of cyclists doesn't impact behavior at all times - otherwise cabbies would be the most cycle friendly motorists on the road...

Safety in Numbers takes care of that. Its not about the instantaneous numbers at any time but the effect of numbers in general on driver behavior. If there are few cyclists around in general then coming across one tends to be a surprise followed by "what am I supposed to do". If you are generally meeting and interacting with cyclists day in day out then you come to expect them to be around and are familiar with how to behave. Its not an effect that operates only in rush hour and fades during the evening.

Final question - why do you think cities like Copenhagen and Amsterdam have such high modal share if it isn't to do with facilities? Surely it isn't all cultural?

Copenhagen and Amsterdam have high cycling levels because they've always had high cycling levels. The major $1Bn build of cycling facilities in the Netherlands started in the mid 80s and ended in the mid 90s. Cycling levels at the start were high compared to the UK and cycling levels at the end were still roughly the same in both countries. The Louisse study of the results in Delft was summarised by SWOV (the Dutch Institute for Road Safety Research) as follows:

"In the 1990s, Louisse et al. (1994) reported the (second) evaluation of the Delft Bicycle Route Network. This city introduced many bicycle facilities in the 1980s. In 1994 the situation in Delft was again studied, and compared with the evaluation that took place a short time after introduction. There is more bicycle use in Delft than in other medium-sized towns, but this was also the case before the introduction of the bicycle route network. The conclusions in the evaluation study were not very positive: bicycle use had not increased, neither had the road safety. A route network of bicycle facilities apparently has no added value for bicycle use or road safety."

You won't find any mention of facilities other than cycle parking in the Dutch Cycle Balance Audit of cycling provision either and when I asked the person who runs it why not his answer was they were not important.

It is very easy to link the high cycling levels to something superficially attractive as a cause but detailed investigation indicates that it is more coincidence than cause.

I believe the Dutch situation is far more to do with urban planning (distances, convenience), discouraging cars from cities and ensuring cycling is seen as a normal everyday activity
 

Tommi

Active Member
Location
London
Some other stuff from the biggest Danish study into the safety of their cycle tracks and lanes in Copenhagen:

"From table 1, it can be deduced that the construction of cycle tracks has resulted in three important gains in road safety: fewer accidents in which cars hit or ran over cyclists from the rear, fewer accidents with cyclists turning left and fewer accidents in which cyclists rode into a parked car. These gains were more than outweighed by new safety problems: more accidents in which cyclists rode into other cyclists often when overtaking, more accidents with cars turning right, more accidents in which cars turning left drove into cyclists as well as more accidents between cyclists and pedestrians and exiting or entering bus passengers."

So the anecdotal observation that they seem to work turns out to be wrong.

That would be http://www.trafitec....0Copenhagen.pdf (only 9 pages)

Having just read the report I come to rather opposite conclusion. Even the last sentence in the report is "These gains are much, much greater than the losses in health resulting from a slight decline in road safety."

Allow me highlight few findings from the report.
  1. The construction of cycle tracks increased the number of car-car injuries by 177%. It's somewhat unclear if this was included in the calculation of overall change. Anyway, the number of injuries to pedestrians and cyclists at junctions increased 28% and 22% respectively.
  2. Most serious reason for increase in injuries is not cycle track per se, but removal of car parking. If car parking is prohibited along the cycle track there's increase in volume of turning cars and the number of injuries (car occupants included) increases by 52%. If car parking is allowed, increase is only 15%.
  3. At signalised junctions depending on how the cycle track/lane reaches the junction the change to number of injuries ranges from -5% to +67% (car occupants included)
  4. At non-signalised junctions raised exits (cycle track when built certain way is one) play a significant role. When cycle track is not raised the number of injuries (car occupants included) goes up 343%, when raised the increase is 81%. With raised exits the number of accidents (note: not injuries!) between pedestrians or cyclists and motor vehicles decreased by 54% and 12%.
  5. The construction of cycle tracks has resulted in 18-20% increase in cycle/moped traffic.
My interpretation is that the increase in cycle traffic by itself explains most of the changes to injuries. When you also take into account the range of different cycle tracks involved in the study, some are good while other are bad, and stick with the good ones the number of injuries especially for pedestrians and cyclists is going to decrease also at junctions.

(There's also the bit about how injuries to women increased by 18% while only %1 to male. Combined with the increase in cycle traffic, fear being the biggest deterrent to cycling, especially for women and that cycle tracks feel the safest the report also seems to support the argument that building infrastructure does increase the number of people cycling. But that's not the topic of this study so I'm not making any claims.)
 
My interpretation is that the increase in cycle traffic by itself explains most of the changes to injuries. When you also take into account the range of different cycle tracks involved in the study, some are good while other are bad, and stick with the good ones the number of injuries especially for pedestrians and cyclists is going to decrease also at junctions.

As I noted further up the thread, when it talks of accidents it means accident rates so the increase in injuries is after taking into account the increase in cycle traffic. Second this is a before and after study of new build cycle tracks and lanes in Copenhagen so its not just taking a mix of existing tracks of variable quality. Its looking at new builds of a number of different types to current best practice.
 
I believe the Dutch situation is far more to do with urban planning (distances, convenience), discouraging cars from cities and ensuring cycling is seen as a normal everyday activity

Some evidence for that from a Danish study.

"Since about half of Danish children have less than 1.5 km to school the decentralised school structure with many fairly small schools is an important reason to the many walking and bicycle journeys. Road design and motorised traffic volumes do influence children’s mode choice, but to a rather limited extent."

A very high proportion (~90%) of UK children walk or cycle to school at those distances, its just that many of them live much further from school than that. The Dutch have similar relatively short distances from home to school as the Danes.
 

As Easy As Riding A Bike

Well-Known Member
Copenhagen and Amsterdam have high cycling levels because they've always had high cycling levels. The major $1Bn build of cycling facilities in the Netherlands started in the mid 80s and ended in the mid 90s. Cycling levels at the start were high compared to the UK and cycling levels at the end were still roughly the same in both countries.

Manchester's pre-war modal share was around 30-40% - where is it now?

I agree that Copenhagen, and Dutch cities and towns, had a much higher initial modal share than UK towns and cities, but since the 1970s, they reversed the decline in bicycle use, and increased their cycling levels significantly, while in the U.K., levels have plateaued.

I don't think this is just about coincidence.

Like you say, it is probably about urban planning, discouraging cars, and improving the perception of cycling as an everyday activity. But - having acknowledged these as possible reasons - I am at a loss as to why you seem so keen to unilaterally rule out the provision of segregated paths on busier urban and intra-urban trunk roads as one of the possible reasons.
 
Manchester's pre-war modal share was around 30-40% - where is it now?

I agree that Copenhagen, and Dutch cities and towns, had a much higher initial modal share than UK towns and cities, but since the 1970s, they reversed the decline in bicycle use, and increased their cycling levels significantly, while in the U.K., levels have plateaued.

I don't think this is just about coincidence.

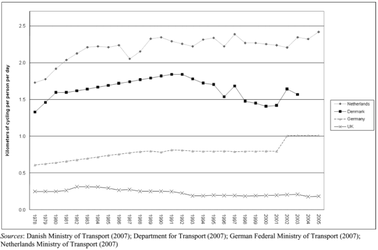
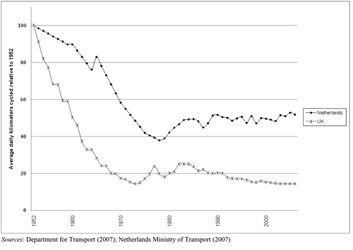
You need to be very careful about baseline dates. Yes, the cycling decline was reversed in the Netherlands in the 70s. But it was also reversed in the UK in the 70s. The reason being the two Oil Shocks of 1973 and 1979 when oil prices shot up to around the same as todays in real terms.

Cycling Trends.png

If you look prior to that then cycle usage dropped much sooner post-WWII in the UK than the Netherlands, primarily because much of Europe had been destroyed but the UK economy was relatively intact so car ownership was more achievable and happened faster. Once the economy recovered and it started falling, it fell almost as fast as in the UK but when arrested by the Oil Shocks, hadn't had time to fall anywhere near as far as in the UK.

From 1980 on and during the period of the Dutch Cycle Master Plan and all the facility building the levels are pretty much plateaued in the Netherlands, Denmark, Germany and the UK.

Cycling Trends 2.png

Like you say, it is probably about urban planning, discouraging cars, and improving the perception of cycling as an everyday activity. But - having acknowledged these as possible reasons - I am at a loss as to why you seem so keen to unilaterally rule out the provision of segregated paths on busier urban and intra-urban trunk roads as one of the possible reasons.

First the evidence is that they are not a reason. Second everyone focuses on them to the exclusion of everything else. The solution is complex but everyone thinks its all about cycle facilities and nothing else. Third, the Dutch experience is you spend $1Bn and neither safety nor cycling levels increase. Think of the effect of having $1Bn to spend on cycle training and driver education. In the overall scheme of things segregated facilities are largely ineffective but a dangerous distraction of attention and money from things that really could make a difference. Given limited resources why are you so keen to spend them on building ineffective segregated cycle paths rather than on demonstrably more effective interventions?
 

As Easy As Riding A Bike

Well-Known Member
You need to be very careful about baseline dates. Yes, the cycling decline was reversed in the Netherlands in the 70s. But it was also reversed in the UK in the 70s. The reason being the two Oil Shocks of 1973 and 1979 when oil prices shot up to around the same as todays in real terms.

Your first graph shows that current the amount of distance cycled in the UK is lower than in 1973, while the Dutch amount of distance is 25-30% higher. Yes, there was a 'bounce' in both countries after the oil shock, but the Dutch have held on to, and even increased, their bounce, while ours has just disappeared. That's what's important, not the fact that there was a reversal in both countries.


From 1980 on and during the period of the Dutch Cycle Master Plan and all the facility building the levels are pretty much plateaued in the Netherlands, Denmark, Germany and the UK.

That's not what your second graph shows. From 1978, km cycled per person per day in the Netherlands has increased from ~1.7 to ~2.4. I don't see how an increase of ~40% since 1978 can be described as a 'plateau'. Although your graph does certainly show that the equivalent measure for the UK has declined.

Second everyone focuses on them to the exclusion of everything else. The solution is complex but everyone thinks its all about cycle facilities and nothing else.

Everyone? To the exclusion of everything else? I don't think so. The segregated approach is hardly appropriate on narrower urban streets, or quieter residential roads - this is where the Dutch implement limited road closures, or shared space, or lower speed limits, or wide cycle lanes, or all of these measures.

No-one is saying cycle tracks are the solution everywhere, or that they are the only solution.

Third, the Dutch experience is you spend $1Bn and neither safety nor cycling levels increase.

But your own graph shows that cycling levels have increased - km per person per day is up 40% since 1978. And safety has increased - Dutch cycle casualties per km travelled have fallen consistently year on year.

Think of the effect of having $1Bn to spend on cycle training and driver education. In the overall scheme of things segregated facilities are largely ineffective but a dangerous distraction of attention and money from things that really could make a difference. Given limited resources why are you so keen to spend them on building ineffective segregated cycle paths rather than on demonstrably more effective interventions?


Well, I certainly don't think it should be 'either or'. But cycle training has been the main strategy for decades - has it really got us anywhere in terms of safety, and/or increasing modal share? People who already don't want to cycle on busy urban roads aren't going to sign up for cycle training in the first place. They just don't fancy it.
 

Richard Mann

Well-Known Member
Location
Oxford
I think you need conditions to be reasonable for cycling, but they don't have to be perfect: a reasonable level of traffic behaving reasonably predictably is enough. The experience in Oxford is that a cycle lane and narrow single traffic lanes is "enough".

You also need to restrict traffic. You can get a long way by slowing traffic down, and jacking up parking costs, but sooner or later you need to do more (especially in larger cities). To get the political support you need to "provide alternatives". The provision might be largely a fig-leaf, but it can't be ignored. The trick is not to spend a silly amount of money on it. Lots of cycle lanes and bus lanes is a good place to start.
 

Origamist

Legendary Member
Safety in Numbers takes care of that. Its not about the instantaneous numbers at any time but the effect of numbers in general on driver behavior. If there are few cyclists around in general then coming across one tends to be a surprise followed by "what am I supposed to do". If you are generally meeting and interacting with cyclists day in day out then you come to expect them to be around and are familiar with how to behave. Its not an effect that operates only in rush hour and fades during the evening.

Numerous cyclists, aggregating (particularly at junctions) does appear to have a traffic calming effect. What's more, cycling in the morning rush-hour is a very different and often considerably more pleasant experience compared to cycling on a Sunday afternoon along the same route. Now, there are of course a number of reasons for this, but I'd still contend that "swarm behaviour" should not be underestimated when considering the SIN effect.
 
That's not what your second graph shows. From 1978, km cycled per person per day in the Netherlands has increased from ~1.7 to ~2.4. I don't see how an increase of ~40% since 1978 can be described as a 'plateau'. Although your graph does certainly show that the equivalent measure for the UK has declined.

And most of that increase was around the late 70's/early 80's when the second Oil Shock of 1979 was active. If you take the period from just before the big investment in facilities of say 1985 to after their completion in the mid 90's so say 2000 there is no significant change. All you are doing is what many others do and select your start date to pull in the effect of petrol shortages many years prior to the building of the facilities. Up until the end of the 80s bicycles didn't really feature in policy at all. It was about curbing the growth of cars and urban planning to place homes, shops, schools and workplaces near to each other to reduce the need for cars. Bicycle thinking only really started at the beginning of the 90s with the Dutch Bicycle Master Plan. So get your time frames right.

No-one is saying cycle tracks are the solution everywhere, or that they are the only solution.

There are plenty of people who are. When have you heard for example, discussion of small distributed schools so that most children are within walking or cycling distance from school? I don't see any discussion of that going on in campaign groups

But your own graph shows that cycling levels have increased - km per person per day is up 40% since 1978. And safety has increased - Dutch cycle casualties per km travelled have fallen consistently year on year.

So have Dutch pedestrian casualties and I doubt its because of the segregated cycling facilities.

Well, I certainly don't think it should be 'either or'. But cycle training has been the main strategy for decades - has it really got us anywhere in terms of safety, and/or increasing modal share? People who already don't want to cycle on busy urban roads aren't going to sign up for cycle training in the first place. They just don't fancy it.


Cycle training the main strategy for decades? Don't make me laugh. Bikeability has only recently come in and is hardly widespread or a main strategy. Before that there was pretty limited cycle training in schools. And adult cycle training is virtually non-existent.
 
Numerous cyclists, aggregating (particularly at junctions) does appear to have a traffic calming effect. What's more, cycling in the morning rush-hour is a very different and often considerably more pleasant experience compared to cycling on a Sunday afternoon along the same route. Now, there are of course a number of reasons for this, but I'd still contend that "swarm behaviour" should not be underestimated when considering the SIN effect.

I think if that were true and the safety in numbers modulated locally and in time according to the number on the road at the moment you would not see a simple power law relationship between average cycling levels and safety that you do see. It would be much more likely to be a S-curve instead with a large amount of data scatter. I agree cycling in London on Sundays is different but think that is mainly because a) there is no congestion charging so there are more cars on the central streets and b) a lot of those cars are driven in from out of town so drivers who are not used to cyclists. If you drive in London on Sundays its quite apparent there are many drivers not familiar with driving in London on the roads.
 

summerdays

Cycling in the sun
Location
Bristol
Some other stuff from the biggest Danish study into the safety of their cycle tracks and lanes in Copenhagen:

"From table 1, it can be deduced that the construction of cycle tracks has resulted in three important gains in road safety: fewer accidents in which cars hit or ran over cyclists from the rear, fewer accidents with cyclists turning left and fewer accidents in which cyclists rode into a parked car. These gains were more than outweighed by new safety problems: more accidents in which cyclists rode into other cyclists often when overtaking, more accidents with cars turning right, more accidents in which cars turning left drove into cyclists as well as more accidents between cyclists and pedestrians and exiting or entering bus passengers."

"There was a 13% decrease in accidents at sgnalised junctions where only one blue cycle crossing had been marked. At signalised junctions where two or four blue cycle crossings had been marked, however, increases of 23% and 61% respectively occurred. Corresponding changes in the number of injuries for one, two and four blue cycle crossings are a fall of 22%, and increases of 37% and 138% respectively."

So the anecdotal observation that they seem to work turns out to be wrong.

Is there any information on the severity of the accidents and how they changed - for example was it more minor or more major accidents?


Some evidence for that from a Danish study.

"Since about half of Danish children have less than 1.5 km to school the decentralised school structure with many fairly small schools is an important reason to the many walking and bicycle journeys. Road design and motorised traffic volumes do influence children’s mode choice, but to a rather limited extent."

A very high proportion (~90%) of UK children walk or cycle to school at those distances, its just that many of them live much further from school than that. The Dutch have similar relatively short distances from home to school as the Danes.

I would say that locally I think quite a large proportion of children would live that close to a primary school (there are primary allocation problems so it isn't about choosing which school you would like further away - though some are forced to travel larger distances to go to their 10th or 15th nearest school) - however I would say there is still a significant amount of children being dropped off by car, mostly by parents on their way to work but not exclusively. I think it used to be close to 50% at my children's school when I was involved with the school travel plan.
 

Origamist

Legendary Member
I think if that were true and the safety in numbers modulated locally and in time according to the number on the road at the moment you would not see a simple power law relationship between average cycling levels and safety that you do see. It would be much more likely to be a S-curve instead with a large amount of data scatter. I agree cycling in London on Sundays is different but think that is mainly because a) there is no congestion charging so there are more cars on the central streets and b) a lot of those cars are driven in from out of town so drivers who are not used to cyclists. If you drive in London on Sundays its quite apparent there are many drivers not familiar with driving in London on the roads.

Cross-sectional data can mask how different cyclists in the different parts of the country at different times of the week/day can experience different levels of risk. As a consequence, I would not be at all surprised if high cycle flows at peak times had a greater impact on cyclist safety than fewer cyclists operating in off-peak conditions.

As for London, I'd also consider c) many bus lanes are deregulated on Sundays.
 
Manchester's pre-war modal share was around 30-40% - where is it now?

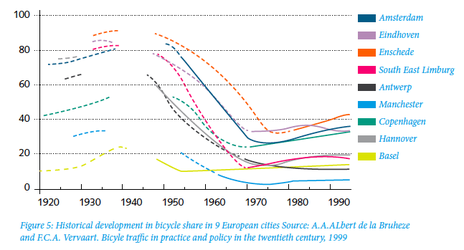
Found an interesting perspective on that specific question from a Dutch study of European cities:

"Historical developments

If we consider the historical developments in bicycle use, there are clear differences between Dutch
cities and other European cities. There are also striking similarities. Figure 5 shows the development
of bicycle use in nine European cities. The overall trend at the start of last century shows an enormous
increase in bicycle use in most European cities. Between 1950 and 1970, bicycle use declined dramatically
with the rise of the car. Ultimately bicycle use rose slightly again in most cities.

Screen shot 2011-05-15 at 08.43.51.png

Apart from the general parallels in the trend lines, we immediately find very striking differences.
Differences in the level on which this general continuous movement takes place, and differences in
strength of the rise and fall of the bicycle use share:

• A high bicycle share (more than 30%) for Amsterdam, Eindhoven, Enschede and Copenhagen - cities
that never saw the arrival of a ‘bicycle use-devouring’ public transport system and where bicycle
traffic had always been a regular component of traffic policy. Accepting the cyclist as a ‘normal’
traffic participant with equal rights in the ’50s and ’60s has been a crucial factor in these cities.

• An average bicycle share (approx. 20%) for South-East Limburg and Hanover. Here, the rise of the
car coincided with a more manifest pro-car policy and a spatial structure which was more in line
with the car.

• A low bicycle share (approx. 10% or below) for Antwerp, Manchester and Basel. Here it is especially
the car-oriented traffic policy that explains matters, and the manifest influence of an early,
properly functioning public transport system (Manchester). The decline which was the result of the
arrival of the motor car continues uninterrupted and without ‘brakes’, because all relevant influencing
factors are pointing in the same direction: a negative collective picture on cycling, a strong
car-oriented policy, realisation of a large-scale car infrastructure, strong suburbanisation.

The differences occuring in the 90’s can mainly be explained from the view of local policy on the role
and value of the bicycle occurring between cities in the ’90s can in the first place be explained from
the view of local spatial and traffic policy and the resulting ‘local picture’ of the role and value of
bicycle use. However, as this explanation is a long-term one it must be considered over decades. With
regard to spatial policy and picture-forming this conclusion is not surprising, as by their very nature
they will only very gradually result in changes. All this left aside, traffic policy also appears to have a
relevant, continuous influence. Political choices made in the ’50s and ’60s still resound in our present
time. In various foreign cities a negative image and the ensuing concrete ‘anti-bicycle’ measures were
intense to a degree that is hard to imagine for the present-day people of the Netherlands."
 
I would say that locally I think quite a large proportion of children would live that close to a primary school (there are primary allocation problems so it isn't about choosing which school you would like further away - though some are forced to travel larger distances to go to their 10th or 15th nearest school) - however I would say there is still a significant amount of children being dropped off by car, mostly by parents on their way to work but not exclusively. I think it used to be close to 50% at my children's school when I was involved with the school travel plan.

More so for primary than secondary schools but both are still further on average than in the Netherlands.

For distances under a mile, 82% of primary school children and 93% of secondary school children in the UK walk or cycle. In the Netherlands its (combined) 85%.

However the average daily distance traveled to school in the Netherlands is 0.3miles walking and one mile by bicycle. In the UK it is 1.5 miles (primary) and 3.4 miles secondary.

Sources: Walking to School factsheet, ONS/DfT 2008; Childstreet 2005 conference, Delft
 
Status
Not open for further replies.
Top Bottom